Sallen-Key Filters: Setting Cutoff Frequency and Quality Factor
- Published
- Author
- Komal Ganvir
- Reads
- 330
Sallen-Key circuits offer a compact way to build active two-pole filters. Component ratios set the response, but the design equations need careful checking.
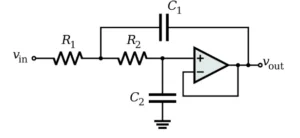
A Sallen-Key filter gives engineers a compact way to build a second-order active filter with two resistors, two capacitors and an operational amplifier. Its practical appeal is the ability to set a filter’s cutoff frequency and response shape through component selection, while using the op-amp as a buffer or in a non-inverting gain configuration. The topology was described by R. P. Sallen and E. L. Key of the Massachusetts Institute of Technology in 1955.
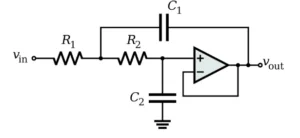
Sallen-Key names the circuit arrangement, not the response curve. Butterworth, Bessel and Chebyshev describe response characteristics; a Sallen-Key circuit can implement a chosen response when its component values and gain are selected accordingly. The common configurations are low-pass and high-pass. Band-pass behavior can also be built with additional circuit arrangements.
What the components control
The two RC sections shape the circuit’s frequency response, while the op-amp buffers the network or supplies non-inverting gain. The component values set the natural frequency and quality factor, Q. These parameters work together: the cutoff region describes where the response turns over, while Q affects the shape around that region, including any peaking or overshoot.
A second-order stage suits applications that need a moderate rate of attenuation beyond the passband. For steeper roll-off, designers can cascade stages, selecting each stage’s values to produce the intended overall response. That adds components and makes the combined response depend on how the stages interact.
Low-pass and high-pass configurations
A low-pass Sallen-Key stage passes lower frequencies and attenuates higher ones. In the unity-gain arrangement described by the following equations, the natural frequency and Q are:
fc = 1 / (2π√(R₁R₂C₁C₂))
Q = √(R₁R₂C₁C₂) / [C₂(R₁ + R₂)]
Here, R₁ and R₂ are resistances, C₁ and C₂ are capacitances, and fc is in hertz. A high-pass Sallen-Key stage uses the corresponding RC arrangement with resistor and capacitor positions interchanged. It passes higher frequencies while attenuating lower ones; its cutoff depends on the selected component values.
These equations depend on the specific circuit arrangement and gain. They shouldn’t be applied without checking that the schematic matches the assumed topology. For a design that uses non-unity gain, the gain also affects Q, so the unity-gain expression alone is insufficient.
Choosing values for a Butterworth response
A second-order Butterworth response has Q ≈ 0.707 and a maximally flat passband magnitude response. For equal resistors, the unity-gain low-pass equation above reduces to Q = 0.5√(C₁/C₂). Reaching Q ≈ 0.707 therefore calls for a capacitor ratio C₁/C₂ ≈ 2. This ratio matters: using equal capacitors with equal resistors would give Q = 0.5 under this equation, a different response.
For example, a 10 kHz low-pass stage can use equal 1.1 kΩ resistors and capacitors of 20 nF and 10 nF. The natural frequency calculated from the stated equation is approximately 10.2 kHz, and the component ratio gives Q ≈ 0.707. These are nominal calculations; the actual response depends on component values and tolerances as well as the op-amp and circuit implementation.
More generally, a convenient scaling choice is R₁ = mR, R₂ = R/m, C₁ = nC and C₂ = C/n. Substituting those relationships into the frequency equation gives fc = 1/(2πRC). Under the stated Q equation, Q = n/(m + 1/m). Designers can use these relationships to separate frequency scaling from component ratios, but should verify the resulting ratios against the definitions of C₁ and C₂ and the schematic. With m = 1, Q = n/2; the same definitions imply C₁/C₂ = n².
Checking the response in simulation and use
Frequency-response simulation can show the cutoff region and attenuation, while transient analysis can reveal the circuit’s response to a step input. A reported simulation for a 10 kHz design gives a cutoff near 10.23 kHz and step-response overshoot around 4%; those results depend on the model and component values used. For a build, compare simulation settings with the actual schematic and selected parts before treating a simulated curve as a prediction.
Sallen-Key stages are used in audio filtering, signal conditioning, sensor circuits and analog front ends ahead of analog-to-digital conversion. Their low component count and use of common resistors, capacitors and op-amps make them convenient for these tasks. The trade-off is that the chosen op-amp and passive components still have to suit the intended frequency range and response. Component tolerances can shift both cutoff and Q, so the design’s nominal equations are a starting point for checking the assembled circuit.